ROCS-like shape overlap in rdkit
One year ago, I gave a brief talk at the RDKit user group meeting in Cambridge. As usual, I ranted about how it would be fantastic to have robust open-source computational chemistry tools. In particular, a commonly used tool from the 80s – gaussian-based shape overlap for pairs of molecules – was only covered by a single open-source package. So, together with help from some friends (big shout out to Greg Landrum, rdkit) I set out to change that. Took almost a year but we're getting there!
The only open-source package doing shape overlap was shape-it from silicos-it. We basically ripped the code out of it and incorporated it into rdkit. The aim was to provide python-scriptable shape-overlap tool. The silicos-it is run by Hans de Winter – big thanks to him – I'm not sure what's going on now but the silicos-it webpage down.
Greg did most (or certainly a _lot_) of work cleaning up the code. Now, we're finally moving towards testing against standard benchmarking sets. Here is an early demo to how the tool works (source available at https://github.com/jandom/rdkit branch RDKit-shape_Nov2013).
The test applied will be to take the crystal ligands from the DUDE dataset, generate some random conformers for those and see if they can be aligned (using our shape overlap code) to the native conformer, seen in crystal structure.
First step, some basic imports and conformer generating function. I'm going a little high with maxIters=2000. Second, a computation kernel that will do all the work. We're loading each file two times - one molecule will be kept as a reference (the correct answer), the other will be manipulated. RMSD is computed with maxIters=0, to just get the RMSD value without any alignment. Finally, let's load some DUDE crystal structures. And the result is below. Tanimoto coefficient (tc) is the normalized volume overlap, bound between 0 and 1 (unitless), a value of 1 indicates perfect volume overlap.
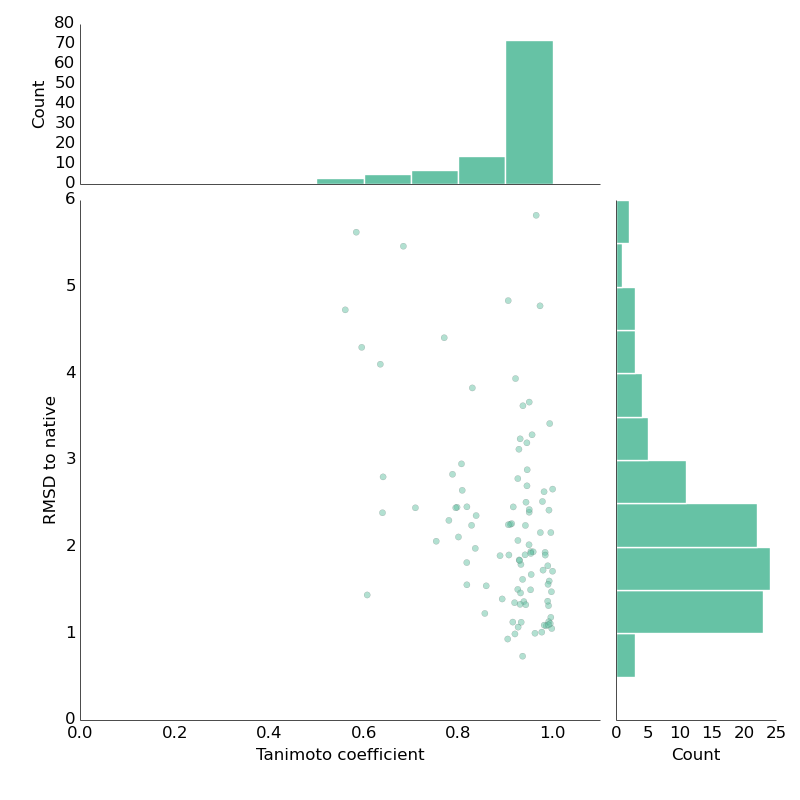
The meaning of this plot is pretty optimistic: you want to be right and to the down. High tc and low RMSD indicates that we're close to the crystal structure by volume overlap. There are some odd cases – how can tc be 0.6 if RMSD is around 1 Angstrom? That would correspond to a case where ligands are indeed very close but (for whatever reason) tc remains low. Conversely, high tc and high RMSD is like a false-positive: tc indicates ligands are close but they're not really. Tc is computed by normalizing the volume overlap between two conformers: in a pathological case, two molecules can have a good overlap but be "flipped" versions of each other (which is then reflected by high RMSD).
The next step is to to a proper DUDE benchmarking run to see if the AUC values for this code compare with ROCS. I'm not expecting for that to be the case, they very likely have some 'secret sauce' but hey, it's a start.
Here is the first one, for a bunch of DUDE targets. The average AUC is better than random but not better than reported in literature for OpenEye ROCS. I guess this could be called the 'poor mans version'.


Here is the aggregate AUC statistic.

And to conclude, a pretty picture showing one of the overlaps.
 Hydrogens are show – even though they're not included in the alignment – to highlight a common problem with ligand force-fields such as UFF/MMFF. Check out the amides there, both are cis- when they should be tran-. But that's a topic for another post...
The only open-source package doing shape overlap was shape-it from silicos-it. We basically ripped the code out of it and incorporated it into rdkit. The aim was to provide python-scriptable shape-overlap tool. The silicos-it is run by Hans de Winter – big thanks to him – I'm not sure what's going on now but the silicos-it webpage down.
Greg did most (or certainly a _lot_) of work cleaning up the code. Now, we're finally moving towards testing against standard benchmarking sets. Here is an early demo to how the tool works (source available at https://github.com/jandom/rdkit branch RDKit-shape_Nov2013).
The test applied will be to take the crystal ligands from the DUDE dataset, generate some random conformers for those and see if they can be aligned (using our shape overlap code) to the native conformer, seen in crystal structure.
First step, some basic imports and conformer generating function. I'm going a little high with maxIters=2000. Second, a computation kernel that will do all the work. We're loading each file two times - one molecule will be kept as a reference (the correct answer), the other will be manipulated. RMSD is computed with maxIters=0, to just get the RMSD value without any alignment. Finally, let's load some DUDE crystal structures. And the result is below. Tanimoto coefficient (tc) is the normalized volume overlap, bound between 0 and 1 (unitless), a value of 1 indicates perfect volume overlap.
The meaning of this plot is pretty optimistic: you want to be right and to the down. High tc and low RMSD indicates that we're close to the crystal structure by volume overlap. There are some odd cases – how can tc be 0.6 if RMSD is around 1 Angstrom? That would correspond to a case where ligands are indeed very close but (for whatever reason) tc remains low. Conversely, high tc and high RMSD is like a false-positive: tc indicates ligands are close but they're not really. Tc is computed by normalizing the volume overlap between two conformers: in a pathological case, two molecules can have a good overlap but be "flipped" versions of each other (which is then reflected by high RMSD).
The next step is to to a proper DUDE benchmarking run to see if the AUC values for this code compare with ROCS. I'm not expecting for that to be the case, they very likely have some 'secret sauce' but hey, it's a start.
Here is the first one, for a bunch of DUDE targets. The average AUC is better than random but not better than reported in literature for OpenEye ROCS. I guess this could be called the 'poor mans version'.
Figure 1. Performance for assorted targets from DUDE-dud38 subset
Figure 2. Performance for targets from the DUDE-diverse subset
Here is the aggregate AUC statistic.
And to conclude, a pretty picture showing one of the overlaps.
Hi Jan, thanks for your excellent work. With respect to the silicos-it website: please check out www.silicos-it.be
ReplyDeleteCheers,
Hans
Thanks Hans, thank you for agreeing to use your code in rdkit.
ReplyDelete